Statistics, Science, Random Ramblings
A blog about data and other interesting things
Building a shiny application to log runs (runlogs version 0.3)
One of the things I like to do in my free time is long distance running. I have been in the sport for about a decade now and after I became somewhat serious about it, I have started to keep track of my activities.
A brief history of how I logged my activities
Initially in 2012, I started carrying my phone during running and tracking runs using a mobile application. However it turned out that carrying a phone became really inconvenient during longer runs for two reasons: 1) around that time phones started to become larger and consequently heavier; 2) even if your phone is relatively lightweight it still becomes really annoying to carry for more than an hour while running. Thus, I stopped carrying my phone during running and started adding runs manually to that mobile app, which turned out to be a pretty mediocre experience, ultimately leading to me logging my runs using spreadsheets.
After a while I bought a GPS watch for running which allows data upload to an associated online platform using a dedicated mobile application. As this can be done after the run is completed, you do not need to carry your phone and the watch does all the work while running. However I never stopped keeping manual logs in spreadsheets; making a new spreadsheet each year, with one page per month, to keep things somewhat tidy. Making new sheets and pages regularly also involved inserting formulas and copy-pasting the basic structure over and over, which could be quite tedious and error-prone.
The obvious advantage of spreadsheets is that the data is fully under your control, which is generally a nice thing and the main reason why I never stopped using them even after buying the GPS watch. The disadvantage is that you have to enter all data manually and analysis-wise you are somewhat limited.
Online platforms have the advantage that you get many visualisations and long-term data conveniently in one place, but the obvious disadvantage is that the data is outside of your control. Furthermore it is really frustrating that data that is obviously erroneous like from a bad GPS signal or spikes in heart rate often-times can not really be corrected and you are stuck with that wrong data.
Building my own application
Considering the limitations of the approaches for logging running data that are
available and given that I am kind of a data person who likes to code
things, a new project was born at the beginning of the year.
This project is the runlogs Shiny application, which you can find
on my Gitlab – it is now available as
version 0.3.
However, it is still very limited, but provides an improvement
over spreadsheets in the way that it orderly stores data and calculations using
that data are of course properly automated.
In the screenshot below you can see the default view when starting the application which shows the current week (I blurred out some names of routes for privacy reasons). Functionality-wise this is of course nothing spectacular, but serves as a nice starting point.
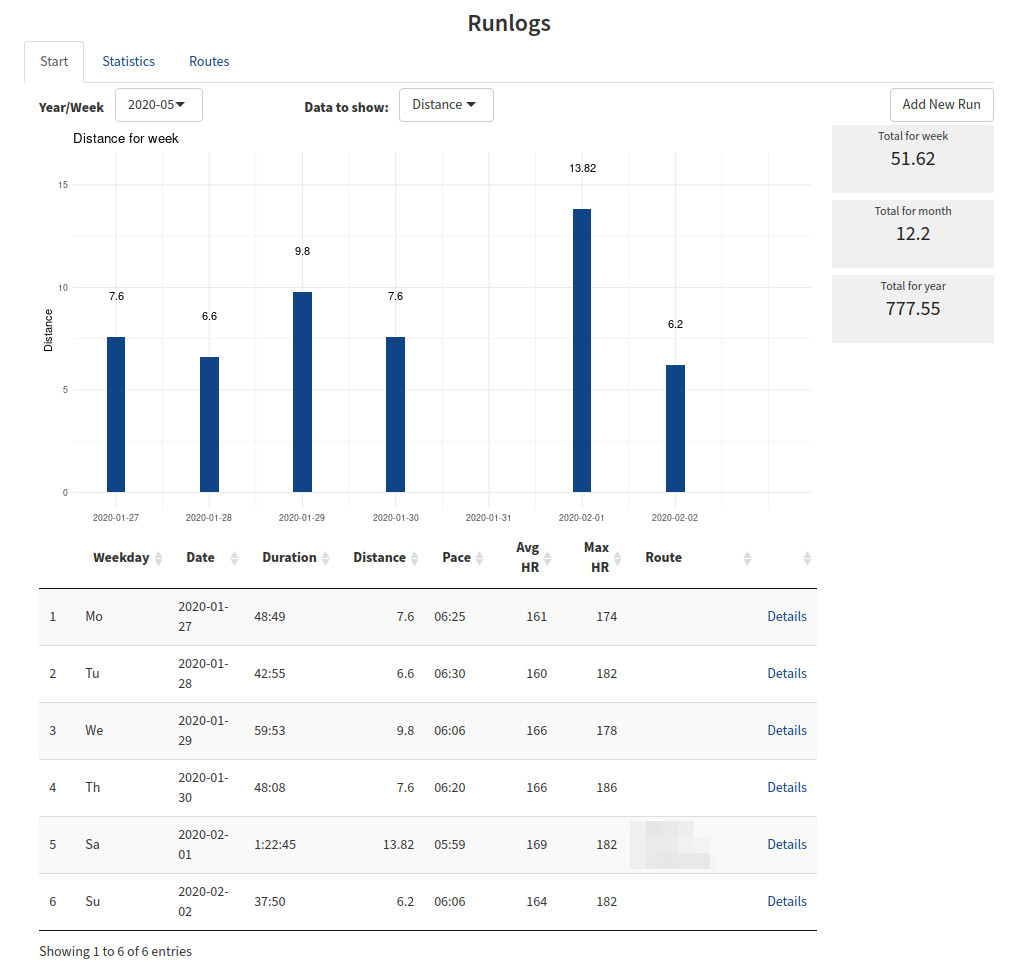
Overall, at this point in time, runlogs has the following features:
- You can save activities, including date, duration, distance and heart rate information. Your pace is calculated automatically on entry.
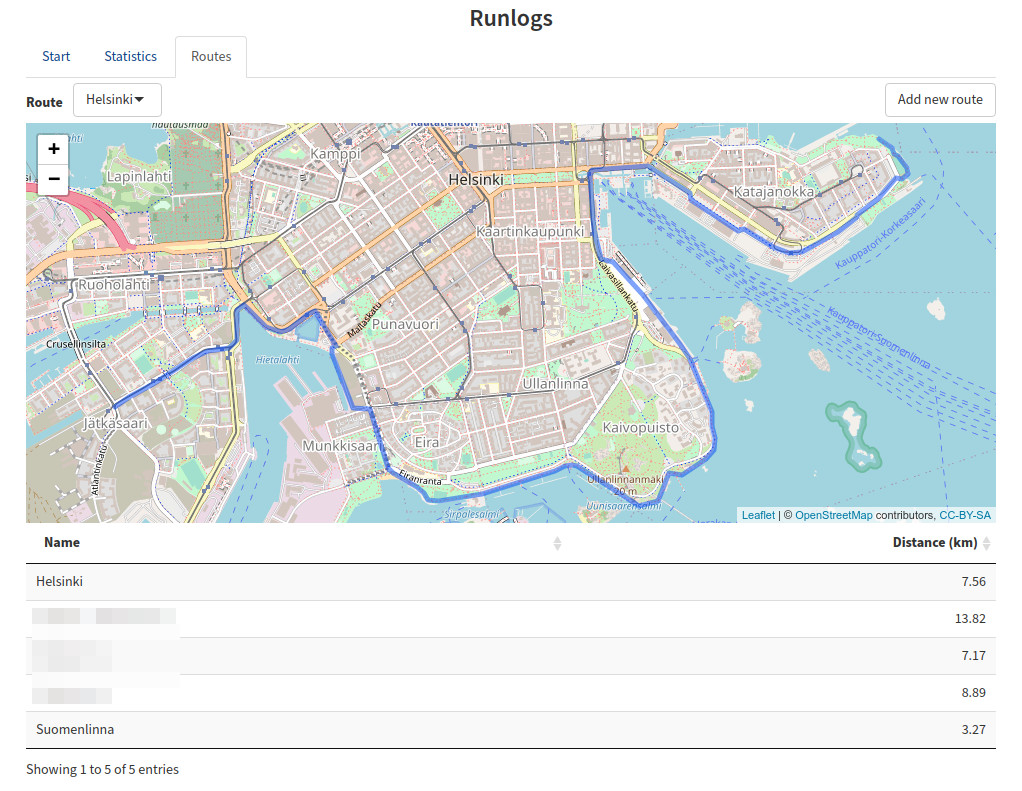
- You can save routes (kml or geojson files) you have drawn in some mapping application. Routes can then be associated with an activity when entering it, automatically providing the distance covered.
- For each week it provides summary graphs and and more detailed table allowing for opening even further details about individual activities.
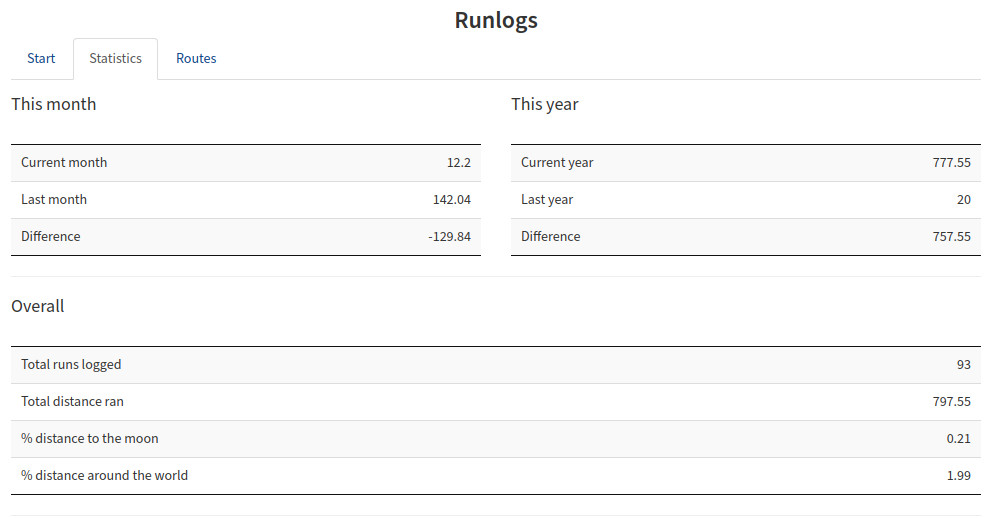
- There is a statistics tab which provides some basic information about
the distance you ran this month, this year and for all runs saved using the
runlogsapplication. For the first two it also gives the difference compared to the previous period. - All information is stored in a SQLite database file.
Below is a screenshot of the route feature (with some information blurred for
privacy reasons and a made up route shown instead)
One of the main points when developing the most recent version of the application was to turn it from something that just works into something more manageable. This included moving most of the functionality which was contained directly in the Shiny application’s main part to Shiny modules instead and also going through some frustrations while finding out that nested observers might be what you think you need, but rarely work out as intended and cause all sorts of issues, including duplicated observers. However, I am positive that this change in the structure of the application will make it much easier to add features in the future.
One of those features was the statistics tab. Adding that tab and the related functionality into the application was straightforward and required only minimal adaptations of the main part of the app’s code. This of course makes breaking the application during development much less likely.
Below you can see a screenshot of that tab. It will most certainly contain more information in future versions.
If you feel a bit adventurous you can certainly try the application for
yourself, by installing it with devtools::install_gitlab("choh/runlogs")
(see the installation instructions in the README for more details).
It was designed with Unix in mind (Linux specifically) and probably works
cross-platform, but at this point in time it makes quite a few assumptions
about file paths.
So running on BSD or MacOS is likely not much of a problem, but I don’t know
about Windows.
At the moment it is also built around the metric system and uses Monday as the first day of the week. These two things will probably become options in the future, but for now it was primarily based on what I need for logging my own running activities. However I do realise, since the UI is in English and this site is in English, a fair share of people reading this might be in the US which has different preferences both for units and the first day of the week.
As this is the first post on this application on this site (as this is the first version polished enough that I am somewhat comfortable with announcing it here), it tends to be on the longer site. Future posts will focus more on the changes made and what my thoughts are behind these. I have quite a list for future additions to this application, so I hope it will become more useful over time.
Until then: happy running!